Upgrade to advanced observability for answers in cloud-native environments
Get actionable answers powered by AI-assistance and continuous automation
TABLE OF CONTENTS:
- Shifting from data collection to answers
- Modern cloud environments need an expanded approach to observability
- Automation, context, and AI required for Advanced Observability
- Automation for scalability and completeness
- Real-time topology mapping provides context across the full stack
- Causation-based code-level AI delivers precise answers
- Looking ahead: OpenTelemetry for better coverage
Observability, when combined with continuous automation and AI-assistance, holds the promise to deliver the actionable answers needed to ensure cloud-native applications work perfectly and cross-collaborative teams can deliver the best user experiences and business outcomes possible.
Chapter 1
Shifting from data collection to answers
The concept of observability is gaining rapid momentum as companies accelerate their digital transformation strategies by building out massive cloud-native environments that are inherently hard to observe and operate, due to their dynamic and complex nature.
At Dynatrace, we went through our own digital transformation, reinventing ourselves as an agile, cloud-native company. We rebuilt our product from the ground up to satisfy and futureproof the growing demands and requirements in observability, automation, and intelligence from some of our customers’ most advanced cloud environments.
We recognized that while observability is important, it’s not enough to just “observe” data– it’s imperative to be able to use that data to deliver answers that ultimately drive better business outcomes.
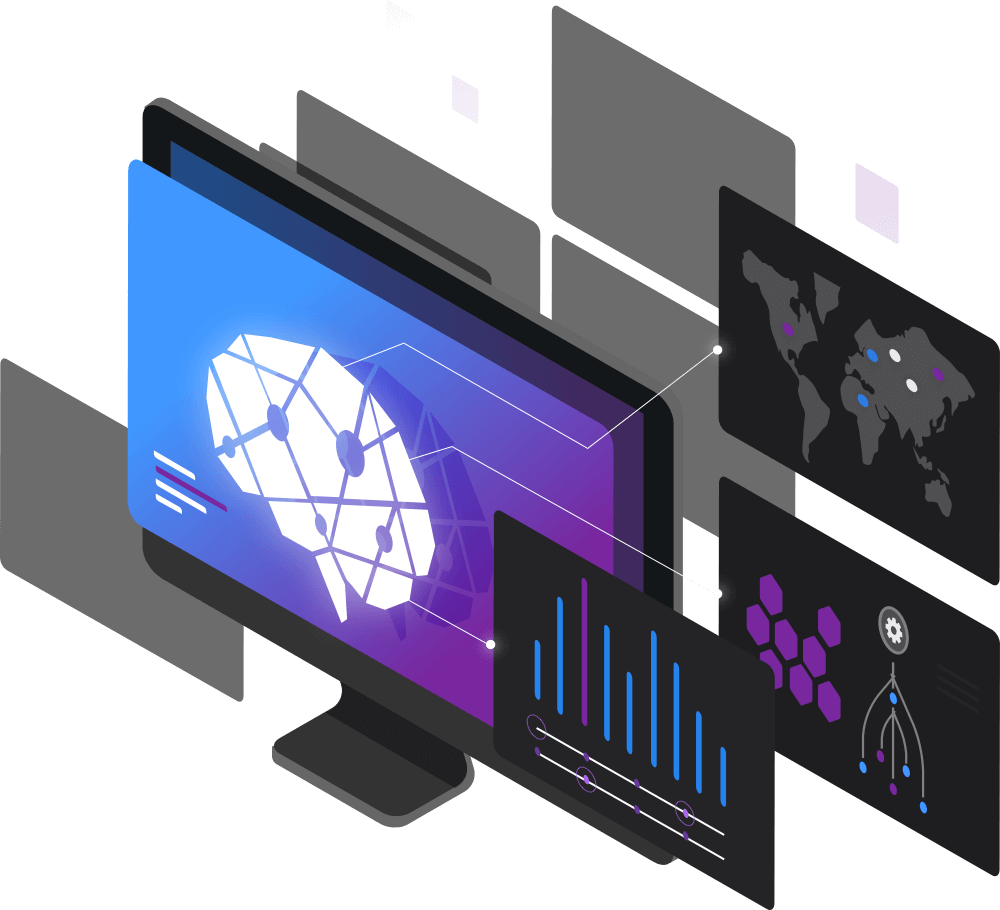
As microservice environments become increasingly dynamic and scale to hundreds of thousands of hosts, the real challenge becomes making sense of data, within the context of the entire technology stack in real-time, to quickly understand the impact to users and prevent business-impacting issues from proliferating. This can be a daunting task that quickly surpasses the capacity of even the most skilled and experienced human operators. That’s why Dynatrace developed a radically different Software Intelligence Platform, expanding on traditional observability with automated, AI-assisted answers that can scale to the largest and most complex environments.
*In software, observability refers to the extent that the internal status and performance of a system can be inferred from its externally available data.
Chapter 2
Modern cloud environments need an expanded approach to observability
Conventional application performance monitoring (APM) emerged when software was mostly monolithic and release cycles were measured in years, not days. Manual instrumentation and performance baselining, though cumbersome, were once adequate—particularly since fault patterns were generally known and well understood.
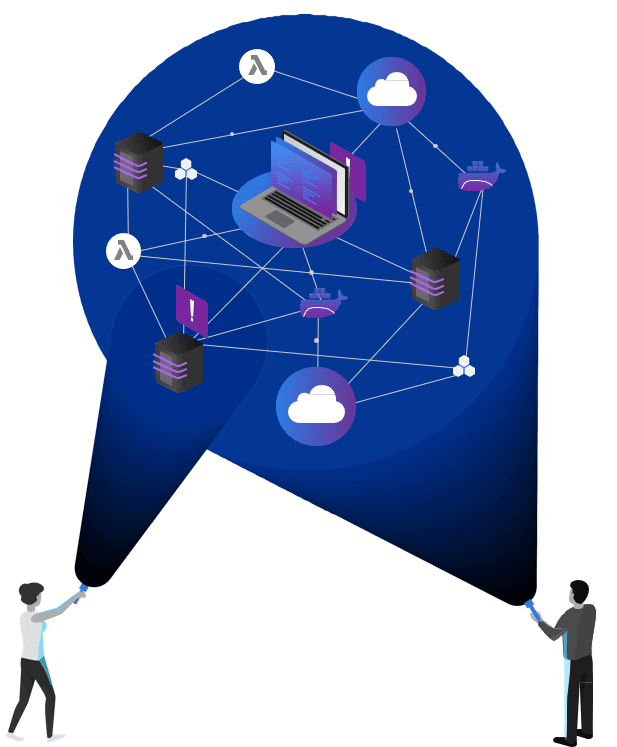
As monoliths have been replaced by cloud-native applications, rapidly growing in size and complexity, traditional monitoring approaches are failing and becoming more resource and cost-intensive. Rather than instrumenting for a predefined set of problems, enterprises now need complete visibility into every single component of these dynamically scaling microservice environments. This includes multi- cloud infrastructures, container orchestration systems like Kubernetes, service meshes, functions-as-a- service and polyglot container payloads.
Such applications are more complex and unpredictable than ever. System health problems are rarely understood at the time of failure, and IT teams waste too much time manually solving problems and putting out fires reactively, allowing issues to grow until customers overwhelm call centers with their problems.
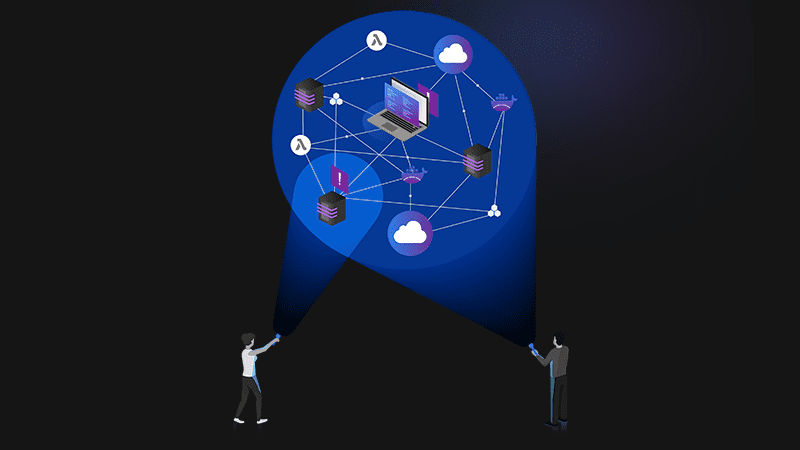
The biggest challenge with modern cloud environments is to address the unknown unknowns—the kind of unique glitches that have never occurred in the past and cannot be discovered via dashboards. These are the growing pains that the concept of traditional observability attempts to tackle.
Chapter 3
Automation, context, and AI required for Advanced Observability
Advanced observability addresses the challenges of cloud-native applications by proposing a better way of collecting data from all system components to gain complete and effortless visibility. Most legacy tools focus on collecting and aggregating three principal data types—metrics, traces, and logs—the so-called three pillars of observability.
Dynatrace has pioneered and expanded the collection of observability data in highly dynamic cloud environments with the OneAgent. In addition to metrics, logs and traces, we also collect user experience data for full-stack, end-to-end code-level observability.
Most importantly, Dynatrace delivers answers, not just more data, through three distinct and completely differentiated capabilities:
Continuous and automatic discovery and instrumentation
to ensure scalability, complete, and always-on coverage in highly dynamic environments with zero manual configuration.
Topology information
for understanding the billions of interdependencies and context between entities across the full-stack and the data being observed.
Causation-based AI engine
to provide actionable answers to problems through real-time, code-level, precise root-cause analysis.
Chapter 4
Automation for scalability and completeness
Most observability approaches require developers to manually instrument their code. In environments with thousands of hosts and microservices that dynamically scale across global, multi-cloud infrastructure, this becomes a futile effort and forces you to shift your team’s primary focus to non-value-add work.
The Dynatrace platform continuously automates data collection and analysis for enterprise-grade scalability and end-to-end advanced observability.
Auto-discovery
Upon installation, the Dynatrace OneAgent automatically detects all applications, containers, services, processes, and infrastructure at start-up in real-time.
Auto-instrumentation
System components are instrumented automatically with zero configuration or code change. Collection of high-fidelity data such as metrics, logs, traces, and user experience, in addition to topology data, begin as soon as a system component becomes available.
Auto-baselining
Dynatrace’s smart baselining automatically learns “normal” performance behaviors and adapts dynamically as the environment changes.
Auto-updates
To minimize ongoing maintenance, the Dynatrace OneAgent continuously, automatically and securely updates throughout the entire environment.
Chapter 5
Real-time topology mapping provides context across the full stack
Metrics, traces, logs, and user experience data are frequently stored without meaningful context that ties them together. With such data silos, assessing the holistic system health and understanding the impact of problems is impossible. For example, you might get an alert for an increased failure rate of service A and another alert because process B has an increase in CPU usage. But you cannot tell if or how these two alerts are related and how real end- users are impacted by them.
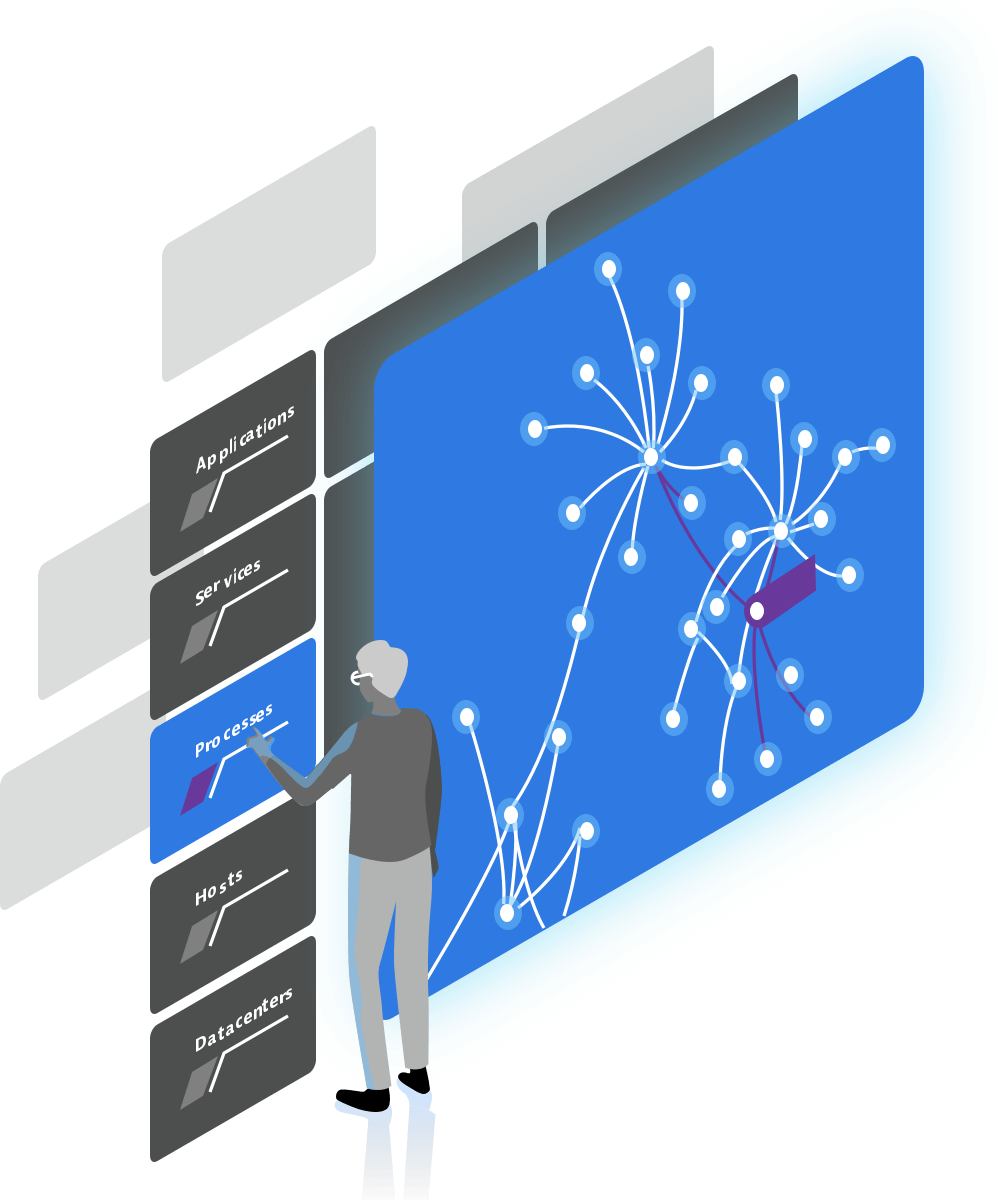
To avoid such data silos, Dynatrace automatically detects and collects a rich set of context metadata to create a real-time topology map called Smartscape. It captures the relationships and dependencies for all system components, both vertically up and down the stack and horizontally between services, processes, and hosts. Within large enterprise systems, there are billions of ever-changing interdependencies, and Smartscape keeps track of them all, all of time.
The topology map enables Dynatrace to understand the actual connection between all captured data, rather than simplistic time- based correlation, which reveals the actual causal dependencies between this captured data. Topology mapping is also the key foundation required that enables AI to make a measurable impact; without it, AI’s usefulness is limited.
Chapter 6
Causation-based code-level AI delivers precise answers
Traditional observability solutions offer little information beyond dashboard visualizations. In the end, it forces technical experts to stop innovation efforts while they manually analyze the data and make educated guesses in time-consuming war rooms.
Despite all efforts, user complaints go unresolved and customers continue to abandon for longer than your organization can afford. Dynatrace is the only Software Intelligence Platform that reliably takes that burden off human operators, as Davis, Dynatrace’s AI engine, automates anomaly root-cause analysis and is purpose built for highly dynamic microservice environments.
But what makes Davis so different to what other platforms offer?
- Built at the core: Davis™ is built at the core of the Dynatrace platform, and processes all advanced observability data from across the full technology stack and third-party data, independent of origin.
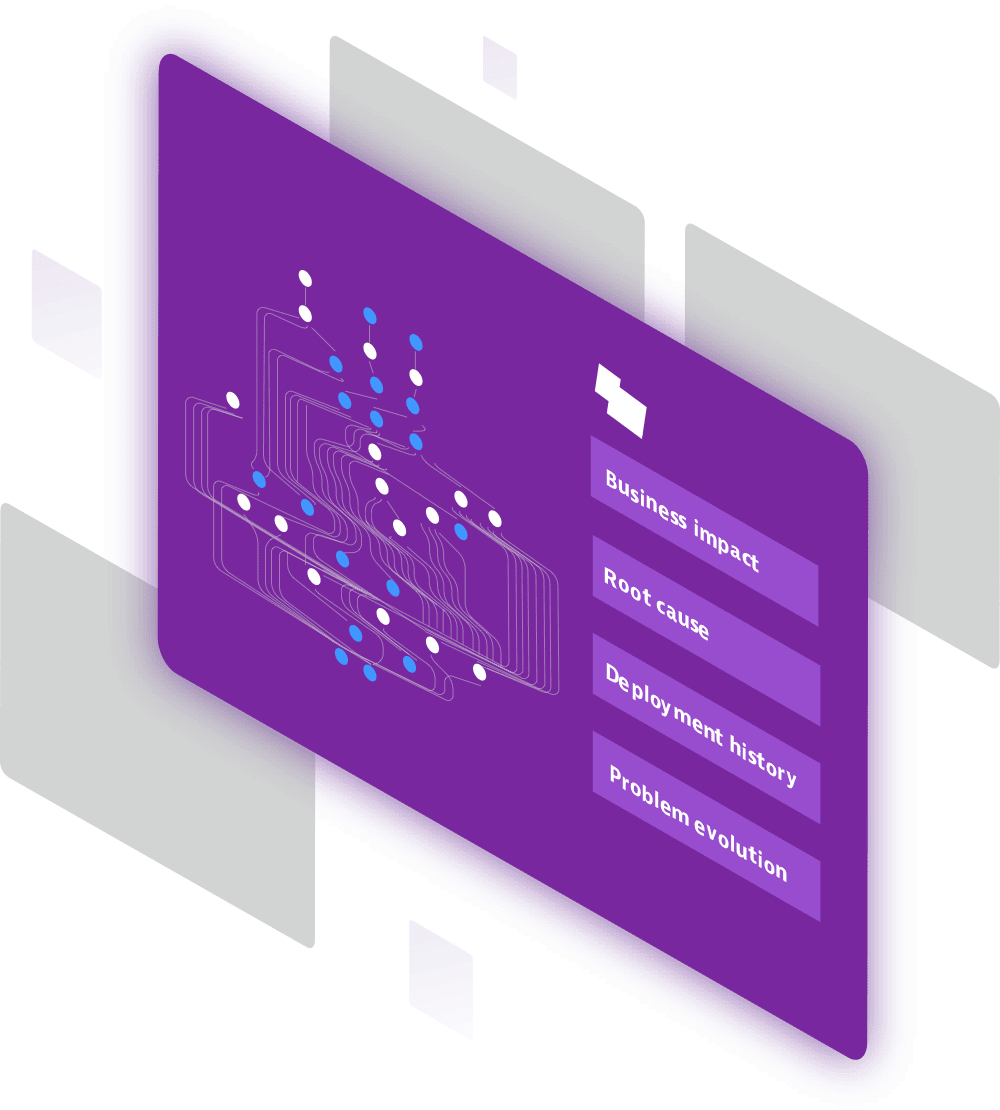
- Precise code-level root-cause analysis: Davis pinpoints malfunctioning components with code-level visibility by probing billions of dependencies in milliseconds.
- Identification of bad deployments: Davis removes the guesswork and knows exactly which deployment or configuration change has caused each particular anomaly.
- Discovery of unknown unknowns: Davis doesn’t rely on predefined anomaly thresholds but automatically detects any unusual “change points” in the data.
- Automatic hypothesis testing: Davis quickly and systematically works through the complete fault tree before making real-time decisions.
- No repetitive model learning or guessing: Unlike machine learning approaches, that can’t discover unknown unknowns, Davis’ causation-based AI relies on a topology map, which is updated continuously in real-time.
Chapter 7
Looking ahead: OpenTelemetry for better coverage
The OpenTelemetry open-source project is spearheaded by the Cloud Native Computing Foundation (CNCF), with the aim of making software more observable and to establish telemetry as a built-in feature of cloud- native software. OpenTelemetry focuses on improving the collection of observability data, specifically metrics and distributed traces for some of the emerging and increasingly adopted cloud frameworks.
This initiative is broadly supported by the open source community, as well as leading contributors including Dynatrace, Google, and Microsoft. Dynatrace is actively contributing and sharing its expertise with auto- instrumentation, interoperability, and enterprise grade solutions. Once OpenTelemetry is more widely adopted as a standard, it will serve as an additional data source that further extends the already impressive breadth of Dynatrace’s technology coverage.
The Dynatrace platform will help enterprises leverage OpenTelemetry by providing the highest possible scalability through automation, full-stack topology mapping, and most importantly, causation-based AI analysis through Davis® to deliver answers, not simply exponentially increasing amounts data to observe.


