
“The thought experiment, Schroedinger’s cat, introduces a cat that is both alive and dead, at the same time. No better analogy exists for describing the complexity of monitoring a platform like Kubernetes, where things come, go, live, and die, dozens of times, every minute.” — Matt Reider, Dynatracer and Kubernetes Wizard
Kubernetes is the de-facto standard for container orchestration as it solves many problems, like distributing workloads across machines, achieving fault tolerance, and re-scheduling workloads when problems occur. While speeding up development processes and reducing complexity does make the lives of Kubernetes operators easier, the inherent abstraction and automation can lead to new types of errors that are difficult to find, troubleshoot, and prevent.
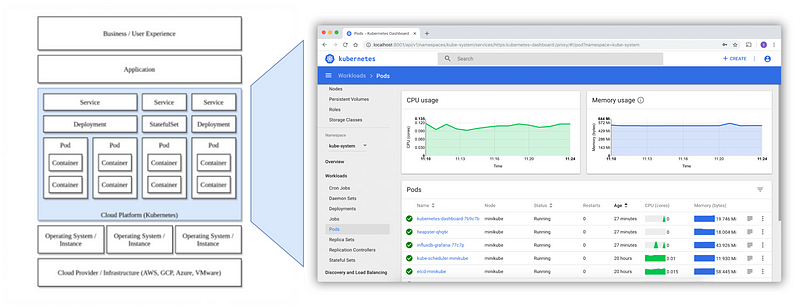
Typically, Kubernetes monitoring is managed using a separate dashboard (like the Kubernetes Dashboard or the Grafana App for Kubernetes) that shows the state of the cluster and alerts when anomalies occur. Monitoring agents installed on the Kubernetes nodes monitor the Kubernetes environment and give valuable information about the status of nodes. Nevertheless, there are related components and processes, for example, virtualization infrastructure and storage systems (see image below), that can lead to problems in your Kubernetes infrastructure.
As a platform operator, you want to identify problems quickly and learn from them to prevent future outages. As an application developer, you want to instrument your code to understand how your services communicate with each other and where bottlenecks cause performance degradations. Fortunately, monitoring solutions are available to analyze and display such data, provide deep insights, and take automated actions based on those insights (for example, alerting or remediation).
The Kubernetes experience
When using managed environments like Google Kubernetes Engine (GKE), Amazon Elastic Kubernetes (EKS), or Azure Kubernetes Service it’s easy to spin up a new cluster. After applying the first manifests (which are likely copied and pasted from a how-to tutorial), a web server is up and running within minutes.
However, when extending the configuration for production, with your growing expertise, you may discover that:
- Your application isn’t as stateless as you thought it was.
- Configuring storage in Kubernetes is more complex than using a file system on your host.
- Storing configurations or secrets in the container image may not be the best idea.
You overcome all these obstacles, and after some time, your application is running smoothly. During the adoption-phase, some assumptions about the operating conditions were made, and the application deployment is aligned to them. Even though Kubernetes has built-in error/fault detection and recovery mechanisms, unexpected anomalies can still creep in, leading to data loss, instability, and negative impact on user experience. Additionally, the auto-scaling mechanisms embedded in Kubernetes can have a negative impact on costs if your resource limits are set to high (or not set at all).
To protect yourself from this, you want to instrument your application to provide deep monitoring insights. This enables you to take actions (automatically or manually) when anomalies and performance problems occur that have an impact on end-user experience.
What does observability mean for Kubernetes?
When designing and running modern, scalable, and distributed applications, Kubernetes seems to be the solution for all your needs. Nevertheless, as a container orchestration platform, Kubernetes doesn’t know a thing about the internal state of your applications. That’s why developers and SRE’s rely on telemetry data (i.e., metrics, traces, and logs) to gain a better understanding of the behavior of their code during runtime.
- Metrics are a numeric representation of intervals over time. They can help you find out how the behavior of a system changes over time (for example, how long do requests take in the new version compared to the last version?).
- Traces represent causally related distributed events on a distributed system, showing, for example, how a request flows from the user to the database.
- Logs are easy to produce and provide data in plain-text, structured (JSON, XML), or binary format. Logs can also be used to represent event data.
- Apart from the three pillars of observability (i.e., logs, metrics, and traces), more sophisticated approaches can add topology information, real user experience data, and other meta-information.
Discover the Dynatrace interactive product tour to explore Kubernetes observability. Dynatrace automatically discovers and maps workloads, containers, pods, and nodes in real-time.
Monitoring makes sense of observability data
To make sense of the firehose of telemetry-data provided by observability, a solution for storing, baselining, and analyzing is needed. Such analysis must provide actionable answers with anomaly root-cause detection and automated remediation actions based on collected data. A wide range of monitoring products with distinct functions, alerting methods, and integrations are available. Some of these monitoring products follow a declarative approach, where the hosts and services to be monitored must be specified exactly. Others are almost self-configuring — they automatically detect entities to be monitored or the monitored entities register themselves when the monitoring agent is rolled out.
A layered approach for monitoring Kubernetes
“Kubernetes is only as good as the IaaS layer it runs on top of. Like Linux, Kubernetes has entered the distro era.” — (Kelsey Hightower via Twitter, 2020)
Although a Kubernetes system may run perfectly by itself, with no issues reported by your monitoring tool, you may run into errors outside of Kubernetes that can pose a risk.
Example:
Your Kubernetes deployment uses virtual machines that run inside dynamically provisioned virtual machine image files (best practice or not). You haven’t detected that there’s a shortage of disk space on the virtualization host (or its shared storage). Now, when the machine image attempts to scale up, your hypervisor stops the virtual machine, thereby making one of your nodes unavailable.
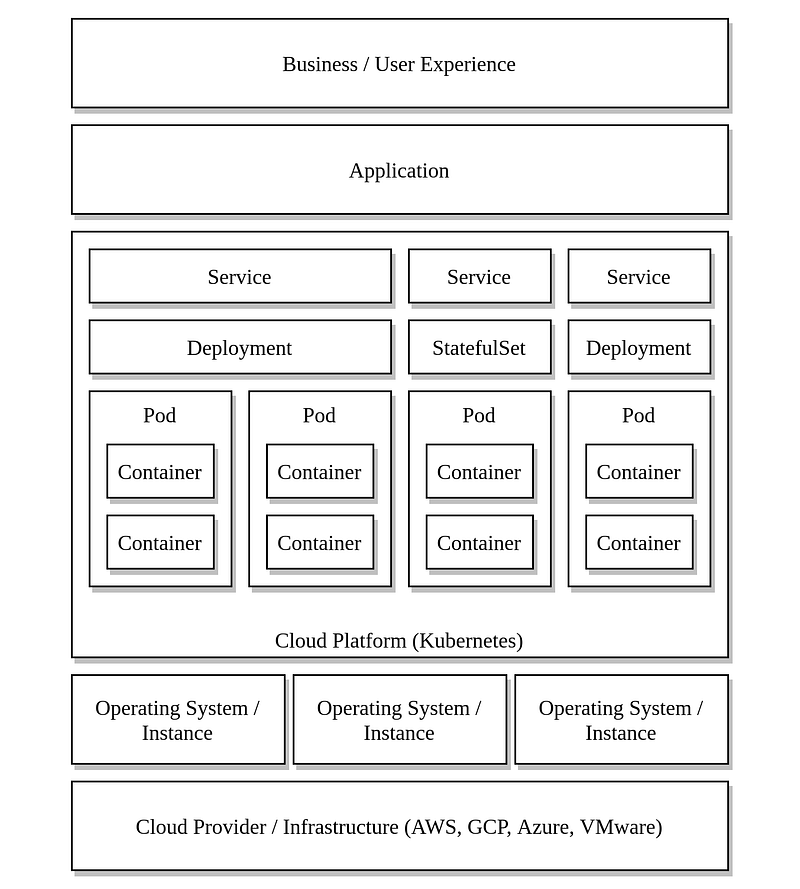
In this example, neither the Kubernetes monitoring itself or the OS agent installed on the Kubernetes node caught the problem. As there are many examples of such cross-cutting anomalies, a more comprehensive approach should be considered for Kubernetes monitoring. Such a solution can be broken down into smaller, more focused domains as shown in the following illustration.
Cloud provider/infrastructure layer
Depending on the deployment model you’re using, problems can occur in the infrastructure of your cloud provider or in your on-premise environment. When running in a public cloud environment, you want to ensure that you don’t run out of resources while also ensuring that you don’t use more resources than will be needed when your Kubernetes cluster starts to scale. Therefore, keeping track of the quotas configured on the cloud provider, but also monitoring the usage and costs of the resources you consumed will help you reduce costs while not running out of resources. Additionally, problems can be caused by changes in the cloud infrastructure. Therefore, audit logs can be exported or directly imported into a monitoring system.
When running your Kubernetes environment on-premise, it’s necessary to monitor all infrastructure components that could affect it. Some examples are the network (switches, routers), storage systems (especially when using thin provisioning), and virtualization infrastructure. Some typical measures for the network would be the throughput, error rates on network interfaces, and even dropped/blocked packets on security devices. Log file analysis helps you proactively detect problems (for example, over-provisioning) before they occur.
Operating system / Instance layer
If you do not run your Kubernetes cluster on a managed service, you are responsible for keeping your operating system up-to-date and maintained. When doing so, it makes sense to check the status of your Kubernetes services (such as kubelet, api-server, scheduler, controller-manager) and the container-runtime (for example, containerd or Docker). Additionally, checking if security updates/patches are available and automatically installing them at the next update cycle should be on your list. Even in this layer, log entries will help you find out if there is something wrong on your system and are a useful source for auditing the system.
Cloud platform layer
By designing the lower layers of your monitoring solution, you ensured that the infrastructure of your Kubernetes environment is stable and observable. Many problems which happen in Kubernetes arise because of misconfigurations in the manifests or because the number of applications in the cluster is growing without expanding the infrastructure.
As described in many guides, you can check if all nodes in your cluster are schedulable (for example, kubectl get nodes). The same can be done with pods, deployments, and any other Kubernetes object type. Especially, when you keep onboarding new services on your cluster, you might figure out that some Pods are in a “PENDING” state. This indicates that the scheduler is unable to do its work properly. Using kubectl describe <kind> <object> will give you more insights and will print out the events related to this object. Often, this information is useful and will give you an idea about what is missing (or misconfigured).
Tip: As for every other clustered system, keep in mind that a node can fail intentionally (for example, following an update) or accidentally. In this case, you want to be able to schedule your workloads on the remaining nodes, so if you are configuring threshold values on your monitoring infrastructure you should plan for such a reserve.
In some cases, you might configure a deployment and find out that no pod will be created (for example, by using a service account that does not exist). One indication that there is something wrong is a diverging value of desired and available pods of a deployment (kubectl get deployment).
Finally, when configuring low memory requests, there might be the situation that your pods restart many times which can happen because they run out of memory. This is simply fixed by adapting the container requests and limits.
Application layer
Even if your infrastructure runs perfectly and Kubernetes shows no errors, you still might hit problems on the application layer.
Example:
You are running a multi-tier application (web server, database) and you configured a HTTP health check which simply prints out “OK” on the application server and one which is running a simple database query on the Database. Both health checks are running perfectly fine and it seems that there is no problem. When a customer tries to run a specific action on the web interface, a white page is shown, and the page loads infinitely.
The application problem in the above example does not force the system to crash and cannot be detected using simple check mechanisms. As described in one of the first sections, however, you can instrument your application to detect such anomalies. For example, traces can show that requests are passed to the application server, the database gets queried, but doesn’t produce a response. After some time, it might happen that additional requests are queued on the application (or some other customers try to do the same thing) and the connection pool fills up (could be a metric). After a while, it might be the case that the HTTP Server itself is no longer able to get requests and after that, the health check will fail.
Using synthetic monitoring techniques, customer behavior is simulated and as a result, the availability from a customer’s view can be validated. In the case of the example described before, a check that simulates this behavior can be set up and it will report an error, as the request does not finish (in time).
Real user monitoring (RUM) gives you insights into the behavior and experience of your users with your application. RUM helps you identify errors, but also find usability issues, like many customers leaving your site at a specific point of an ordering process.
Business layer
The best new feature can be unsuccessful if the customer is unable to use it or does not like it. Therefore, mapping changes or new features in your application to business-related metrics like revenue or conversion rate can help quantify the results of your software development efforts. For instance, an updated version of an application can be identified using tags, and the metrics (for example, orders per hour) compared to the previous version. If you see a negative impact on these metrics, rolling back to the last successful version is to be a good remediation option.
Possible solutions
Many products exist to support you on your Kubernetes monitoring journey. If you prefer to use open source products, there are a lot of CNCF (Cloud Native Computing Foundation) projects, like Prometheus for storing and scraping monitoring data. Additionally, OpenTelemetry helps with instrumenting software and Jaeger is used to represent tracing data. Other projects, as Zabbix and Icinga can help you to monitor your services and infrastructure. Grafana is a tool for representing data collected by almost any monitoring tool.
While many open-source tools are specialized to fulfil their use cases well, commercial solutions typically cover a broader set of infrastructure, application, and real user monitoring use cases. For example, Dynatrace covers all the functionality described in this article out of the box, with the smallest setup effort. If you want to know more about Dynatrace features for Kubernetes monitoring, have a look at these four blog posts:
- Expand application and infrastructure observability with operational insights into Kubernetes pods
- Monitoring of Kubernetes Infrastructure for day 2 operations
- 60 seconds to self-upgrading observability on Google Kubernetes Engine
- AWS EKS Monitoring as a Self-Service with Dynatrace
Conclusion
When designing a monitoring solution for Kubernetes, there are many things to consider beyond Kubernetes itself. By breaking up your monitoring into smaller chunks, teams are able to focus on and maintain their areas of responsibility. For instance, application deployments can be switched from a on-premises to a public cloud infrastructure deployment without affecting the monitoring of the application itself.
As Kubernetes is a highly dynamic orchestration platform and application instances can come and go in a short time, a monitoring solution that can deal with this behavior ensures a smoother monitoring experience.
There are a lot of approaches and tools that can support you on your monitoring journey. Commercial observability platforms, such as Dynatrace, enable you to monitor your Kubernetes infrastructure comprehensibly with little setup effort.


Looking for answers?
Start a new discussion or ask for help in our Q&A forum.
Go to forum