
The Dynatrace open analytics and AI platform provides scale, zero configuration, automatic alerting, and root cause analysis for your custom metrics—now also including OpenTelemetry metrics, powered by exporters for a broad range of languages.
Today’s highly dynamic, heterogeneous, and complex software systems require organizations to establish observability for all provided cloud-native services. With observability across all these technologies, teams can quickly deploy high-quality releases that deliver outstanding customer experiences. To ensure observability, the open source CNCF project OpenTelemetry aims at providing a standardized, vendor-neutral way of pre-instrumenting libraries and platforms and annotating userland code. As the application owner of an e-commerce application, for example, you can enrich the source code of your application with domain-specific knowledge by adding actionable semantics to collected performance or business metrics.
However, especially in heterogeneous, web-scale environments, you need an easy way to make sense of the large amounts of data you’re collecting. To get performance insights into applications and efficiently troubleshoot and optimize them, you need precise and actionable analytics across the entire software life cycle.
Therefore we’re happy to announce that you can now start ingesting your OpenTelemetry-instrumented custom metrics into the Dynatrace open analytics and AI platform, which provides scale, zero configuration, automatic alerting, and root cause analysis.
New OpenTelemetry metrics exporters provide the broadest language support on the market
Our new OpenTelemetry custom metric exporters provide the broadest language support on the market, covering Go, .NET, Java, JavaScript/Node.js, and Python. With this support, developers now have a vendor-neutral way to report metrics from their applications, covering use cases such as:
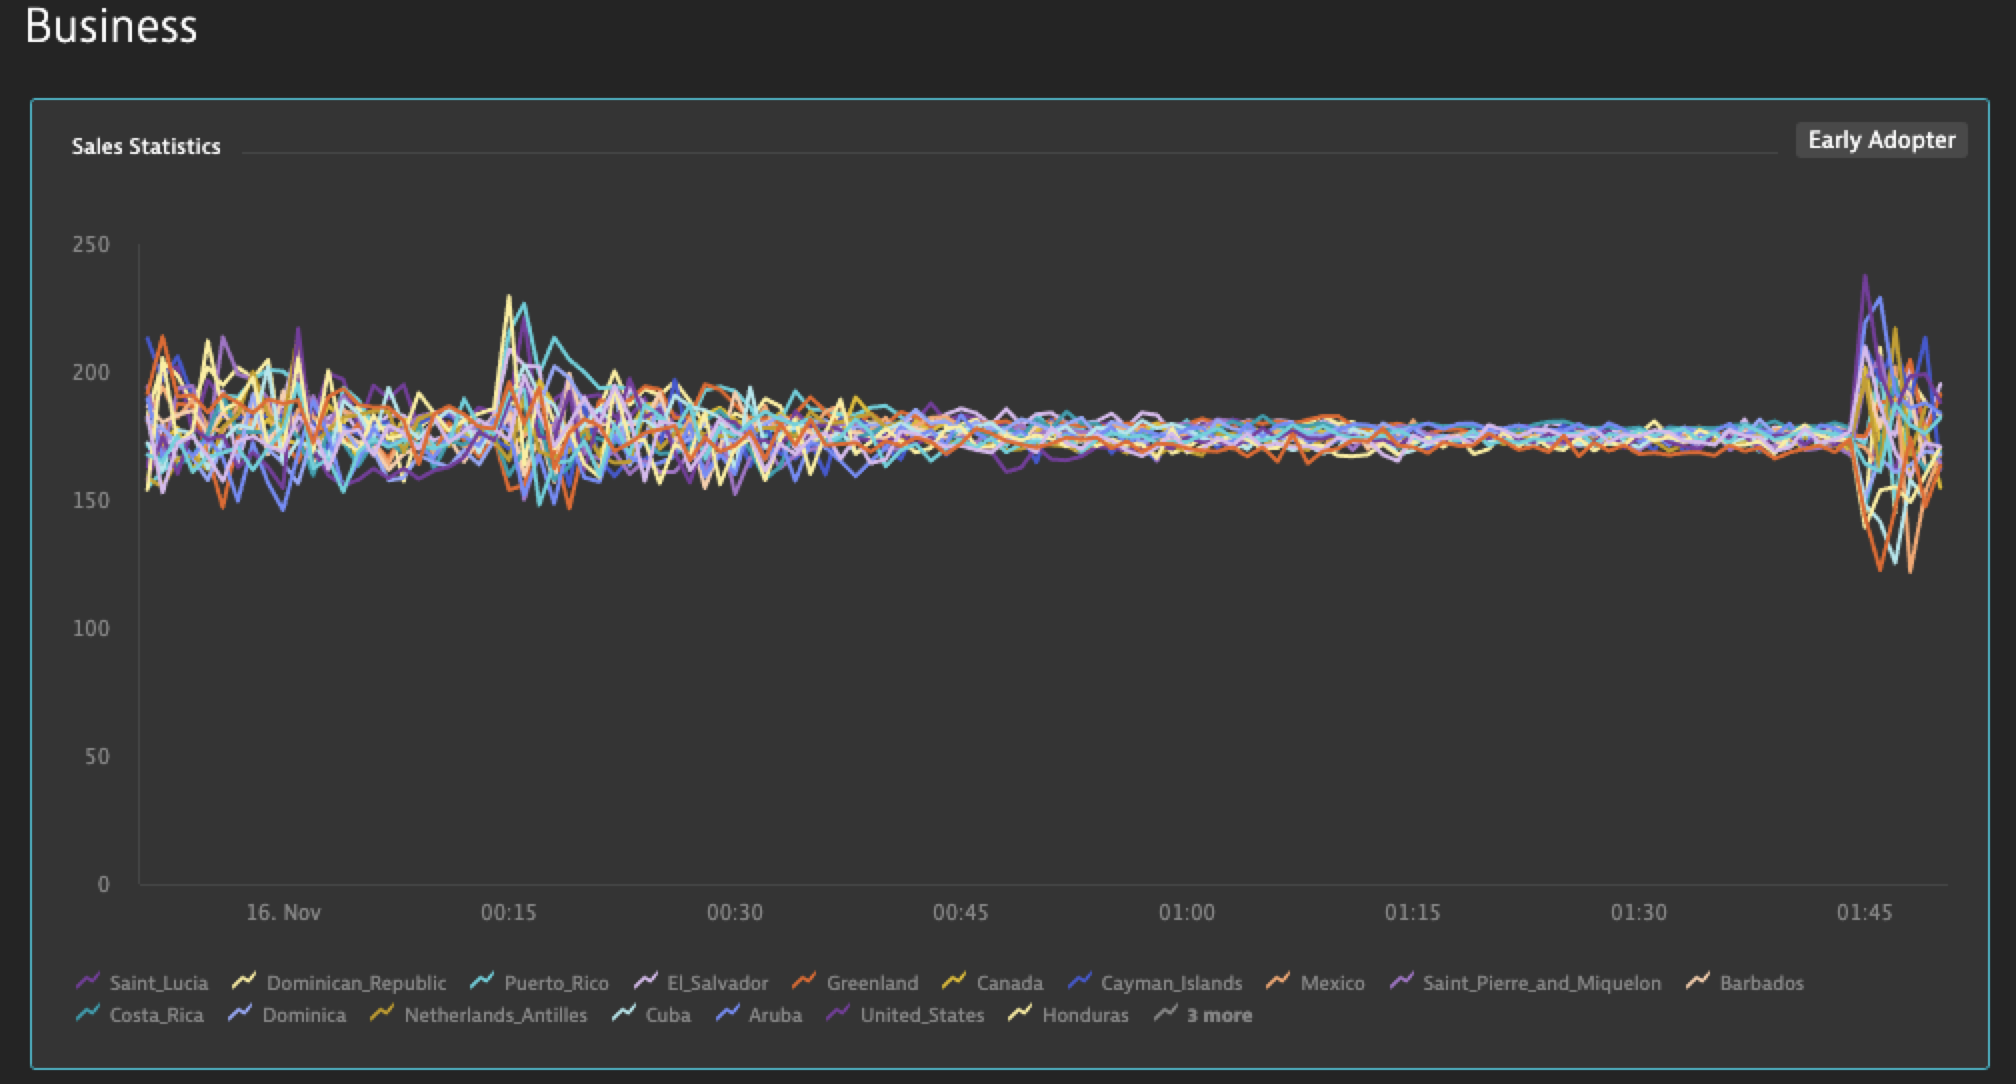
- Collecting the number of sales per country per continent, to continuously provide business insights to management
- Gathering performance metrics like memory usage from systems where an agent can’t be installed
- Getting specific metrics from libraries that are pre-instrumented with OpenTelemetry (for example, database drivers)
Seamlessly export your OpenTelemetry custom metrics to Dynatrace
Dynatrace is all about seamless integration and developer experience. If you already have Dynatrace OneAgent in place, you can of course take advantage of the built-in OneAgent multidimensional metric API for ingestion of your OpenTelemetry custom metrics. With this approach, you don’t have to concern yourself with scale, encryption, firewalls, or even where your metrics should be sent for analysis—OneAgent takes care of all this for you.
If there is no OneAgent present, all you have to do is to provide the endpoint URL of your Dynatrace ActiveGate or Cluster and an API token.

Dynatrace is your enterprise-grade observability platform for OpenTelemetry metrics
We believe in open standards and we’re supporting the OpenTelemetry community in making built-in instrumentation for platforms and libraries a commodity. In the meantime, we’re focusing on seamless integration, storing and analyzing telemetry data at web scale, and providing the enterprise-grade single pane of glass that Dynatrace customers have come to know and love.
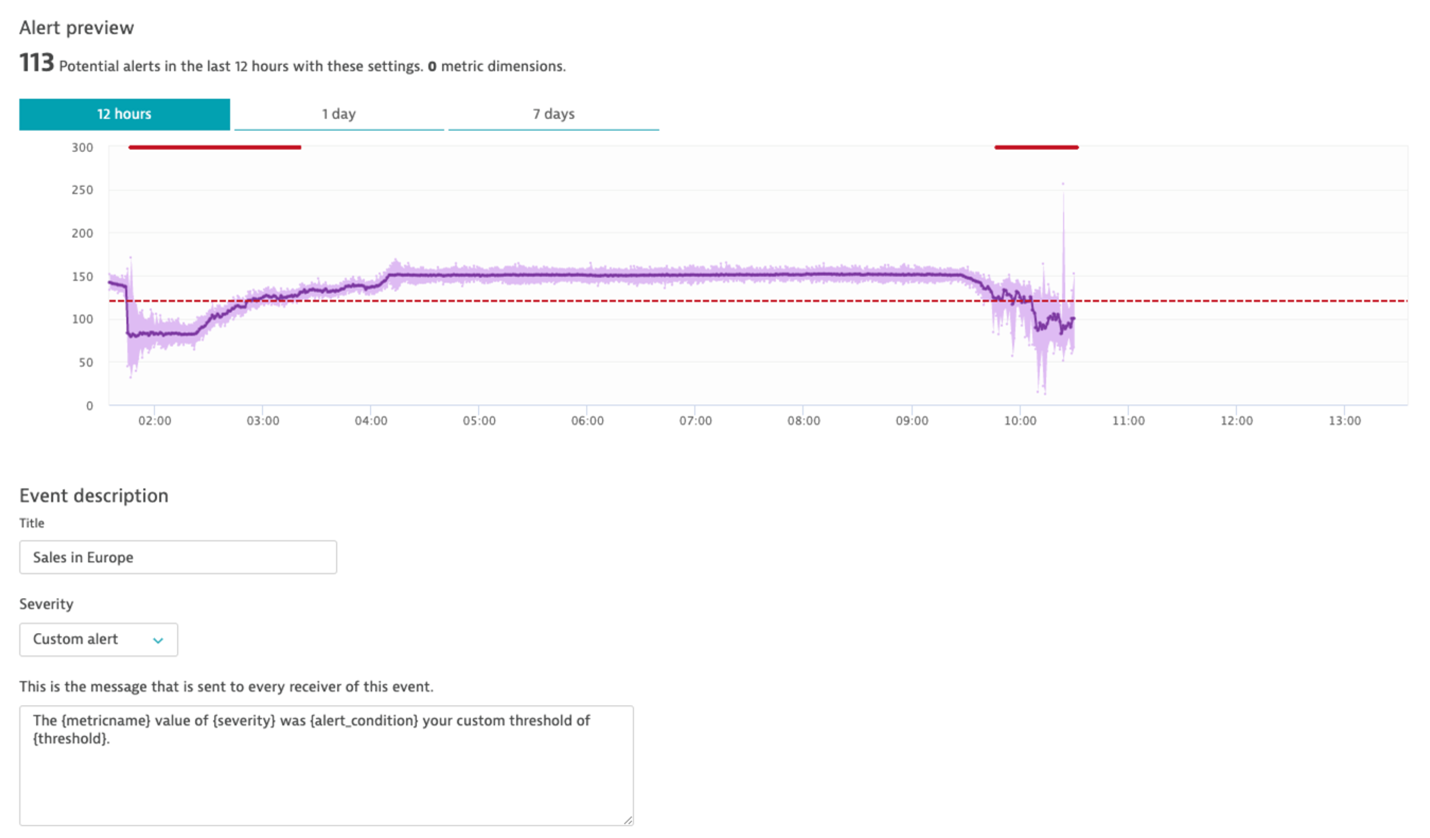
Once the exporter is in place, Dynatrace starts ingesting, storing, and analyzing your data. Of course, all the ingested metrics are available to the Davis® AI and support auto-adaptive baselining or threshold-based alerting. So you don’t need to worry about data retention, security, or scale—Dynatrace has you covered.
Seeing is believing
New to Dynatrace? Get enterprise-grade observability into your OpenTelemetry custom metrics by starting your free trial today.
The OpenTelemetry metrics exporters are open source projects, available on GitHub. If you’re interested in learning more about OpenTelemetry or joining the community, a good place to start is the OpenTelemetry GitHub repository. To get involved with the community, you can either join the relevant weekly SIG meetings or reach out to them on Gitter.
And if you have read this far…
Read Part 2 of this blog series where we dive into two use cases:
- Collecting and analyzing business metrics to continuously provide business insights to management
- Pre-instrumenting an open-source framework to collect usage statistics
What’s next
As we’re fully embracing OpenTelemetry with PurePath 4 seamless integration of OpenTelemetry data, stay tuned for upcoming announcements around the capture of OpenTelemetry and OpenTracing trace data and providing extended end-to-end traceability for pre-instrumented third-party libraries that emit OpenTelemetry and OpenTracing telemetry data.
We’re currently also working on providing an OpenTelemetry collector for metrics to offer a vendor-agnostic, highly stable, and performant implementation for receiving, processing, and reporting metrics.


Looking for answers?
Start a new discussion or ask for help in our Q&A forum.
Go to forum